|
 WEN Lab's Geospatial Computing: Development of Algorithms and Software
 Estimating Reproductive Numbers
of Disease Diffusion
Estimating Reproductive Numbers
of Disease Diffusion
R package: EpiTrans
|@Github|
Installation
EpiTrans Tutorials:
1. Dengue;
2.
COVID-19
Introduction:
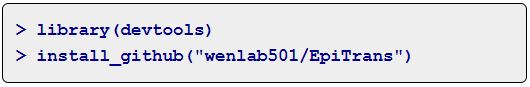
The package provides a new method for
quantifying spatially
adjusted (time-varying) reproductive numbers
that reflects spatial heterogeneity in transmission potential among individuals.
This new method estimates individual-level effective reproductive numbers and a
summarized indicator for population-level time-varying reproductive number. We
provides the
tutorials which include sample datasets
from the dengue outbreak in Tainan City, 2007 and the
COVID-19 cases in northern Taiwan, 2021, and demonstrates the major
functions of the package , including (1) plotting descriptive epidemic trends in
time and space; (2) estimating spatially-adjusted reproductive numbers; (3)
visualizing the graphics and animations of individual-level and aggregated-level
reproductive numbers. The list of detailed functions and sample datasets
can be found
here.
Further Reading:
Ng TC, Wen TH *
(2019), Spatially Adjusted
Time-varying
Reproductive Numbers: Understanding the Geographical
Expansion of Urban Dengue Outbreaks, Scientific Reports
9: 19172.
Epi-Pro (Epidemic Profiler):
The Software for Profiling Epidemics
Language: Python 3.x + Qt
User Interface

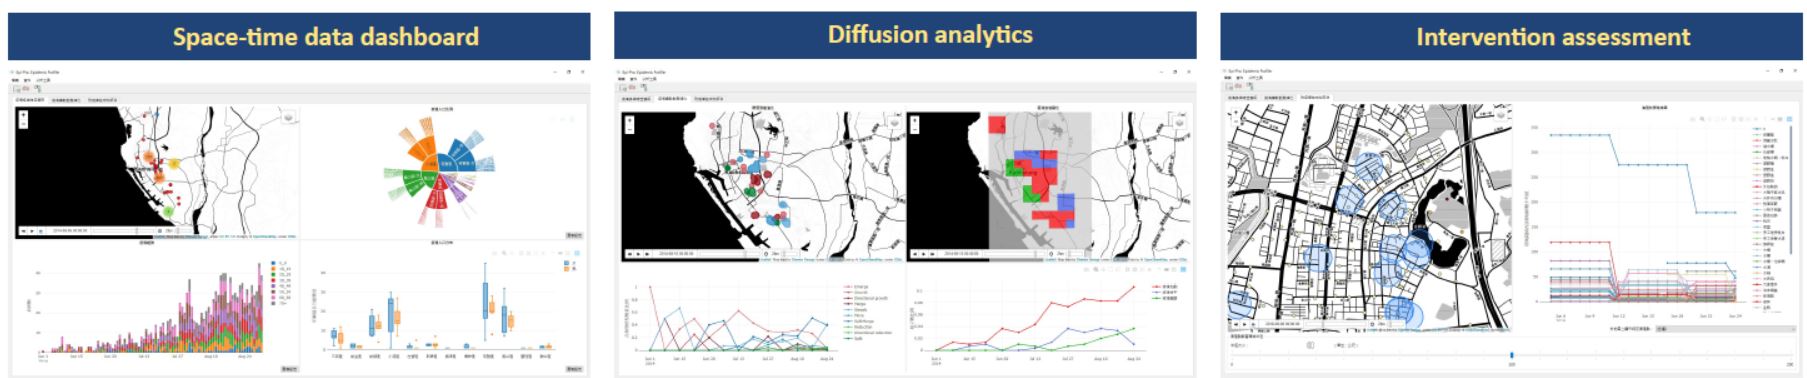
Epi-Pro's Diffusion Analytics
|
PySDA (Python Suite for Diffusion Analysis)
| how
to install |
PySDA Cluster Evolution: Modified Space–Time DBSCAN (MST-DBSCAN) |
Tutorial
Language: Python 3.x
Introduction: Epidemic diffusion is a
space–time process, and showing time-series disease maps is a common way to
demonstrate an epidemic progression in time and space. Previous studies used
time-series maps to demonstrate the animation of diffusion process. Epidemic
diffusion patterns were determined subjectively by visual inspection, however.
There currently are still methodological concerns in developing effective
analytical approaches for profiling diffusion dynamics of disease clustering and
epidemic propagation. The objective of this study is to develop a
geo-computational algorithm, the modified space–time density-based
spatial clustering of application with noise (MST-DBSCAN), for
detecting, identifying, and visualizing disease cluster evolution, which takes
the effect of the incubation period into account. We also map the MST-DBSCAN
algorithm output to visualize the diffusion process. Our results show that
compared to kernel-smoothed mapping, the MST-DBSCAN algorithm can better
identify the evolution type of any cluster at any epoch. Furthermore, using only
one two-dimensional map (and graphs), our approach can demonstrate the same
diffusion process that time-series maps or three-dimensional space–time kernel
plotting displays but in an easy-to-read manner. We conclude that our MST-DBSCAN
algorithm can profile the spatial pattern of epidemic diffusion in detail by
identifying disease cluster evolution.
Further Reading: Kuo FY, Wen TH *, Sabel C (2018),
Characterizing Diffusion Dynamics of Disease Clustering: A
Modified Space-Time DBSCAN (MST-DBSCAN) Algorithm,
Annals of the American Association of Geographers 108(4):1168-1186.
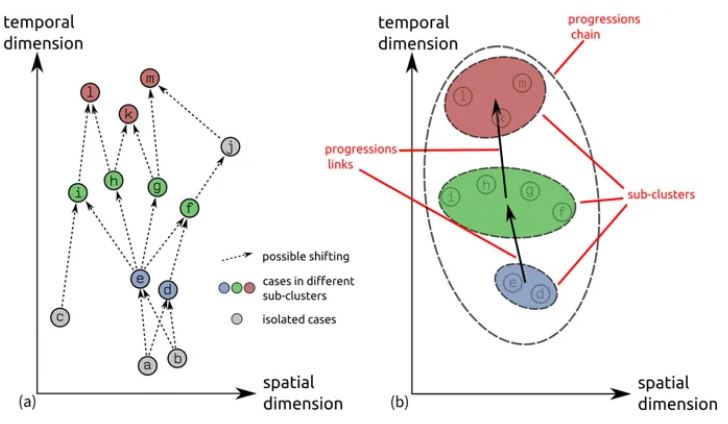
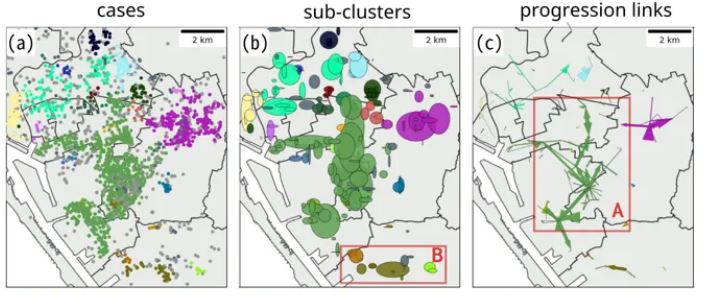
PySDA Diffusion Structure: TrAcking Progression In Time And Space (TaPiTaS)
|
Tutorial
Language: Python 3.x
Introduction:
A diffusion process can be considered as the movement of
linked events through space and time. Therefore, space-time locations of events
are key to identify any diffusion process. However, previous clustering analysis
methods have focused only on space-time proximity characteristics, neglecting
the temporal lag of the movement of events. We argue that the temporal lag
between events is a key to understand the process of diffusion movement. Using
the temporal lag could help to clarify the types of close relationships. This
study aims to develop a data exploration algorithm, namely the TrAcking
Progression In Time And Space (TaPiTaS) algorithm, for understanding
diffusion processes. Based on the spatial distance and temporal interval between
cases, TaPiTaS detects sub-clusters, a group of events that have high
probability of having common sources, identifies progression links, the
relationships between sub-clusters, and tracks progression chains, the connected
components of sub-clusters. Dengue Fever cases data was used as an illustrative
case study. The location and temporal range of sub-clusters are presented, along
with the progression links. TaPiTaS algorithm contributes a more detailed and
in-depth understanding of the development of progression chains, namely the
geographic diffusion process.
Further Reading: Chin WC, Wen TH *, Sabel C, Wang IH (2017),
A Geo-Computational Algorithm for Exploring the
Structure of Diffusion Progression in Time and Space,
Scientific Reports 7:12565.
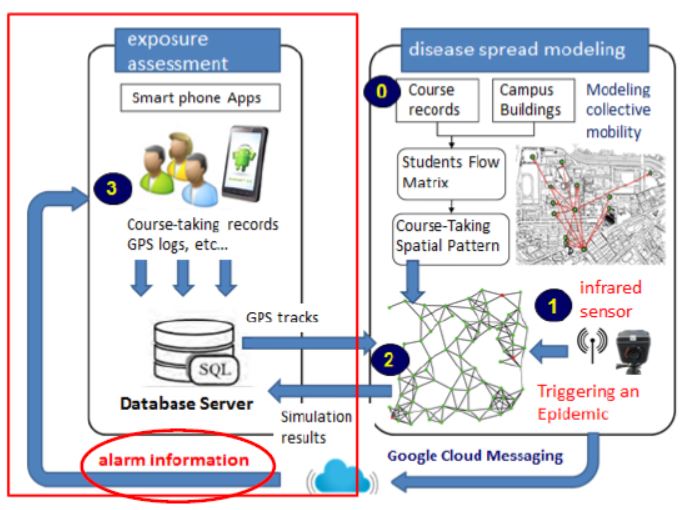
Assessing Personal Exposure to Disease Transmission Risk

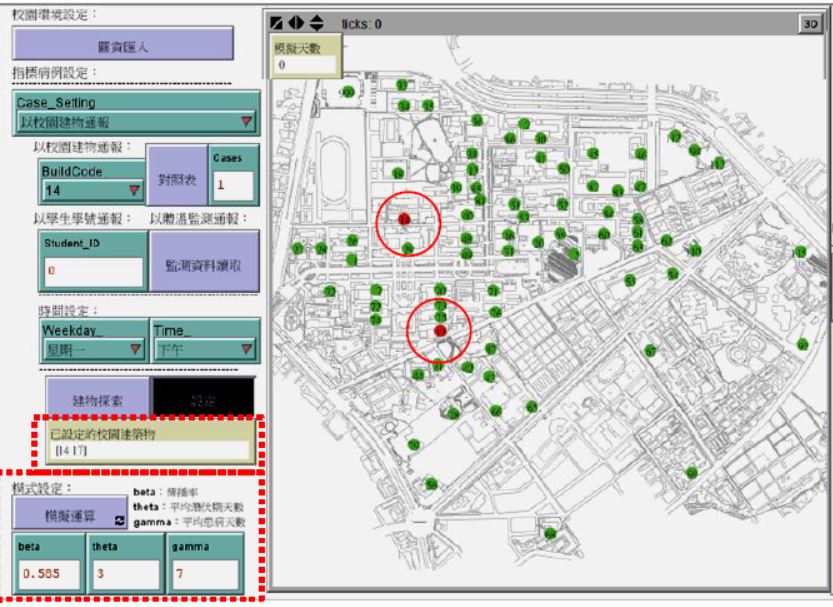
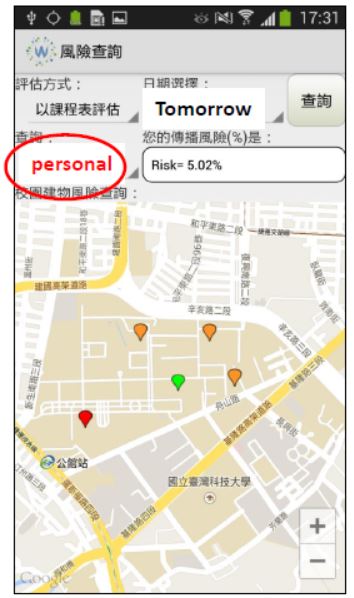
Language: Microsoft Visual C# + Android app
development
Introduction:
Due to the complex interactions between human behaviors
and the environment, it is important to quantify the association between
environmental exposure and human health. Recent studies have indicated that
different
behaviors by an individual may result in different levels of risk exposure.
Different personal behaviors should be incorporated into a framework used to
assess risk exposure. Therefore, we established a location-based
client-server architecture to assess the exposure of an individual to the risk
of contagious disease transmission. The framework integrates with the
transmission dynamics of the disease simulation models and can reflect
transmission risks due to behavioral changes in a timely manner. Apps on smart
phones are an appropriate platform for individuals to effectively collect
information on changes in personal mobility behaviors. Through a location-based
framework, individuals can also receive timely risk alerts to assess their
movement patterns and reduce their risks of exposure to infection. We
successfully integrated disease transmission dynamics with mobility behaviors
and developed a personalized exposure assessment framework that will broadcast
the individual risks of exposure to infection in a timely manner. We were also
invited to demonstrate the architecture prototype in
Future Tech Expo in 2017.
Further Reading: Wen TH *, Hsu CS, Sun CH, Jiang JA, Juang JY
(2018),
A Location-Based Client-Server Framework for
Assessing Personal Exposure to the Transmission Risks of Contagious Diseases,
In Shaw SL and Sui D (Eds.). Human Dynamics Research in Smart and Connected
Communities, Springer Series: GeoJournal Library, Springer.
Detecting Spatial-Temporal
Thresholds of Food-borne Disease Outbreaks
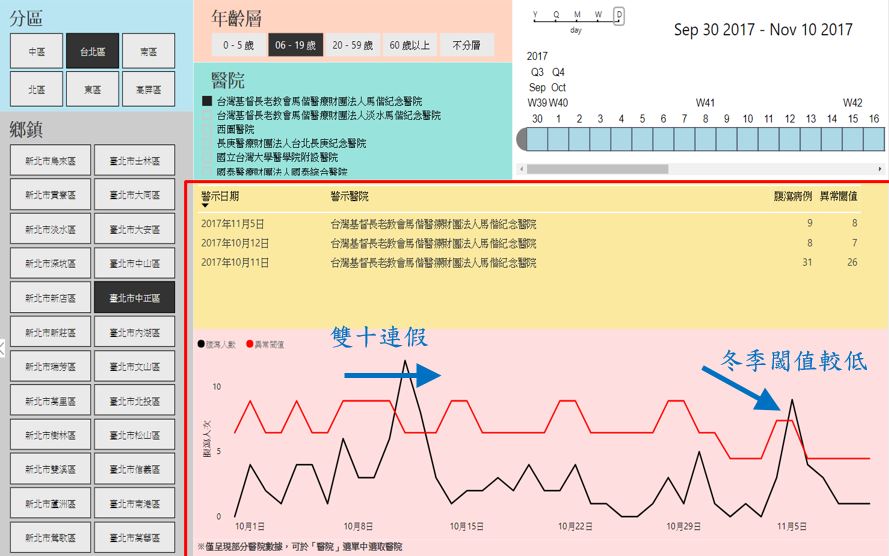
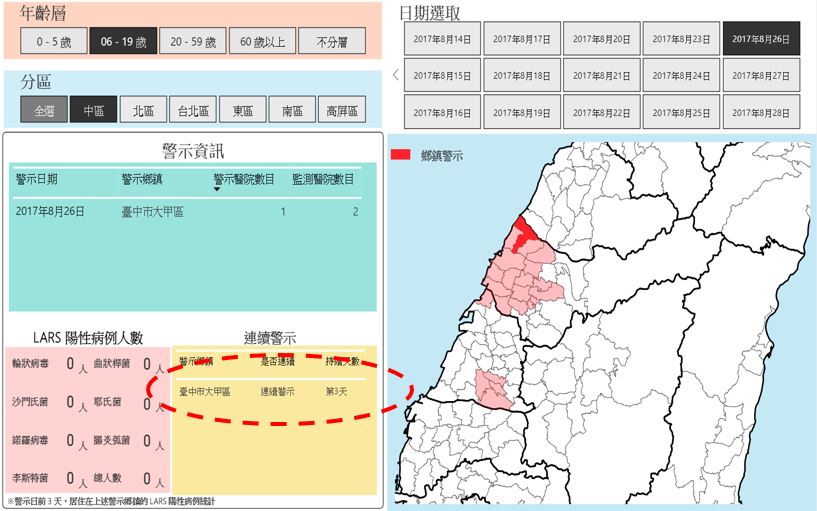
Language: Microsoft Visual C# + Power BI
We integrated Real-time Outbreak and Disease Surveillance System (RODS),
Laboratory Automated Reporting System (LARS) and Sentinel Surveillance System
for establishing an early-warning framework for warning possible
outbreaks of food-borne diseases. A Block Maxima Model was conducted to
determine epidemic thresholds and detect unusual diarrhea clusters from RODS for
warning the possible outbreaks. The model results are validated from the
reported cases in the LARS database and syndromic surveillance data. RODS’s
Diarrhea hotspots in 2016 were analyzed to establish epidemic thresholds for
warning possible outbreaks of food-borne pathogen infection for each age group
in 2017. Our results showed that, for each age group, the sensitive (true
positive rate) is above 0.85, and positive likelihood ratio (LR+) is also above
2.0. The specificity (true negative rate) is above 0.6 and negative likelihood
ratio (LR-) is below 0.2. Our early-warning framework successfully demonstrated
the performance of detecting locations and timing of possible epidemic events
prior to the time local health bureau received reported cases. The early-warning
framework shows the acceptable ability of warning possible outbreaks of
food-borne pathogen infection. We concluded that the diarrhea hotspots in RODS
could reflect the clusters of hospitals with food-borne pathogen infection in
LARS.
Further Information: Taiwan Centers for Disease Control
(Taiwan-CDC) Research Grant IDs: MOHW106-CDC-C-114-000301;
MOHW105-CDC-C-114-000301; MOHW104-CDC-C-114-000704
Flow-based PageRank
(FBPR): A Flow-based Ranking Algorithm
Language: Python 3.x
Introduction:
For a growing number of developing cities, the capacities
of streets cannot meet the rapidly growing demand of cars, causing traffic
congestion. Understanding the spatial–temporal process of traffic flow and
detecting traffic congestion are important issues associated with developing
sustainable urban policies to resolve congestion. Therefore, the objective of
this study is to propose a flow-based ranking algorithm for
investigating traffic demands in terms of the attractiveness of street segments
and flow complexity of the street network based on turning probability. Our
results show that, by analyzing the topological characteristics of streets and
volume data for a small fraction of street segments in Taipei City, the most
congested segments of the city were identified successfully. The identified
congested segments are significantly close to the potential congestion zones,
including the officially announced most congested streets, the segments with
slow moving speeds at rush hours, and the areas near significant landmarks. The
identified congested segments also captured congestion-prone areas concentrated
in the business districts and industrial areas of the city. Identifying the
topological characteristics and flow complexity of traffic congestion provides
network topological insights for sustainable urban planning, and these
characteristics can be used to further understand congestion propagation.
Further Reading: Wen TH *, Chin WC, Lai PC (2017),
Understanding the Topological Characteristics and Flow
Complexity of Urban Traffic Congestion, PHYSICA
A: Statistical Mechanics and Its Applications 473:166-177
Geographically Modified
PageRank Algorithms
Language: Python 2.x
Introduction: A network approach,
which simplifies geographic settings as a form of nodes and links, emphasizes
the connectivity and relationships of spatial features. Topological networks of
spatial features are used to explore geographical connectivity and structures.
The PageRank algorithm, a network metric, is often used to help identify
important locations where people or automobiles concentrate in the geographical
literature. However, geographic considerations, including proximity and location
attractiveness, are ignored in most network metrics. The objective of the
present study is to propose two geographically modified PageRank
algorithms—Distance-Decay PageRank (DDPR) and Geographical PageRank (GPR)—that
incorporate geographic considerations into PageRank algorithms to identify the
spatial concentration of human movement in a geospatial network. Our findings
indicate that in both intercity and within-city settings the proposed algorithms
more effectively capture the spatial locations where people reside than
traditional commonly-used network metrics. In comparing location attractiveness
and distance decay, we conclude that the concentration of human movement is
largely determined by the distance decay. This implies that geographic proximity
remains a key factor in human mobility.
Further Reading: Chin WC, Wen TH * (2015),
Geographically Modified PageRank Algorithms: Identifying
the Spatial Concentration of Human Movement in a Geospatial Network,
PLOS ONE 10(10): e0139509.
A Stirring Genetic
Algorithm (SGA) with Spatial and Temporal Weighting Schemes
Language: MATLAB
Introduction: Out-of-hospital
cardiac arrest (OHCA) occurs when the heart is deprived of oxygen without
immediate medical treatment. The use of publicly accessible automated external
defibrillators (AEDs) is generally considered to be an effective pre-hospital
measure. Although studies have been undertaken to determine the locations of AED
installations, the spatial and temporal characteristics of OHCA occurrence have
not been considered comprehensively. This study attempts to assess the
feasibility of using the 7-Eleven chain of convenience stores as possible
locations for the installation of AEDs to capture the spatial and temporal
characteristics of OHCA patients. The methodological framework was divided into
two stages. The first stage involved the development of two weighting
schemes, a temporally weighted model (TWM) and a spatially weighted model (SWM),
to capture the temporal and spatial variations in selecting AED locations. In
the second stage, we proposed a stirring genetic algorithm (SGA)
to select the limited subset of 7-Elevens covering the most weighted
OHCA occurrences from the first stage. We considered two modes of conveyance,
human running and vehicle transportation, by setting the service range of the
7-Elevens at 100 and 300 m. We conclude that each 7-Eleven has a different role
for allocating AEDs in an urban setting. The AEDs at 7-Elevens in commercial
areas help to compensate for the temporal gap of emergency medical service (EMS)
in nighttime occurrences and for a high incidence of OHCA patients. For
convenience stores in residential areas, AEDs help to compensate for the spatial
gap in areas that are far from fire stations.
Further Reading: Tsai YS, Ko PC, Huang CY, Wen TH *
(2012) Optimizing Locations for the Installation of
Automated External Defibrillators in Urban Public Streets Through the Use of
Spatial and Temporal Weighting Schemes, Applied
Geography 35: 394-404.
Estimating
the Place-of-Residence in
National Health Insurance Research Databases (NHIRD) |
code
Language: SAS Macro
Introduction:
Understanding the geographic patterns and regional
differences in health status plays an important role in public health research;
however, the place-of-residence (township level) of an insured is not available
in National Health Insurance Research Databases (NHIRD). The objective of this
study was to propose principles for estimating the place-of-residence (township
level) in NHIRD. Based on demographic characteristics, insurance classification,
location of hospital visit, and insurance registration of the insured, this
study compared three methods of estimating the place-of-residence
(township level) from the Longitudinal Health Insurance Database of NHIRD
in 2005. Official statistics of the usual resident population in each
township from the Department of the Interior were used as reference data for
comparisons among the three methods. The study further verified these methods by
comparing the estimated numbers and official statistics for the medical
treatment of lung and liver cancer patients in 2005. This study found that the
method which combined insurance classification, location of hospital visit, and
insurance registration provided an optimal estimate of place-of-residence in
each area by different levels of urbanization and age-group. Consideration of
either location of hospital visit or insurance registration may be appropriate
for specific townships and age groups. This study demonstrated the feasibility
of estimating place-of-residence in NHIRD and the applicability of these
proposed methods.
Further Reading: Lin MH, Yang AC, Wen TH * (2011),
Using Regional Differences and Demographic Characteristics
to Evaluate the Principles of Estimation of the Residence of the Population in
National Health Insurance Research Databases (NHIRD),
Taiwan Journal of Public Health 30(4): 347-360.
Multilayer Epidemic
Dynamics Simulator (MEDSim) |
Demo
Language: MATLAB
Introduction:
We describe an innovative simulation framework that
combines daily commuting network data with a commonly used population-based
transmission model to assess the impacts of various interventions on epidemic
dynamics in Taiwan. Called the Multilayer Epidemic Dynamics Simulator (MEDSim),
our proposed framework has four contact structures: within age group, between
age groups, daily commute, and nationwide interaction. To test model flexibility
and generalizability, we simulated outbreak locations and intervention scenarios
for the 2009 swine-origin influenza A (H1N1) epidemic. Our results indicate that
lower transmission rates and earlier intervention activation times did not
reduce total numbers of infected cases, but did delay peak times. When the
transmission rate was decreased by a minimum of 70%, significant epidemic peak
delays were observed when interventions were activated before new case number
50; no significant effects were noted when the transmission rate was decreased
by less than 30%. Observed peaks occurred more quickly when initial outbreaks
took place in urban rather than rural areas. According to our results, the
MEDSim provides insights that reflect the dynamic processes of epidemics under
different intervention scenarios, thus clarifying the effects of complex contact
structures on disease transmission dynamics.
Further Reading: Tsai YS, Huang CY, Wen TH *, Sun CT, Yen MY
(2011), Integrating Epidemic Dynamics with Daily
Commuting Networks: Building a Multilayer Framework to Assess Influenza A (H1N1)
Intervention Policies. Simulation: Transactions
of The Society for Modeling and Simulation International 87(5): 385-405.
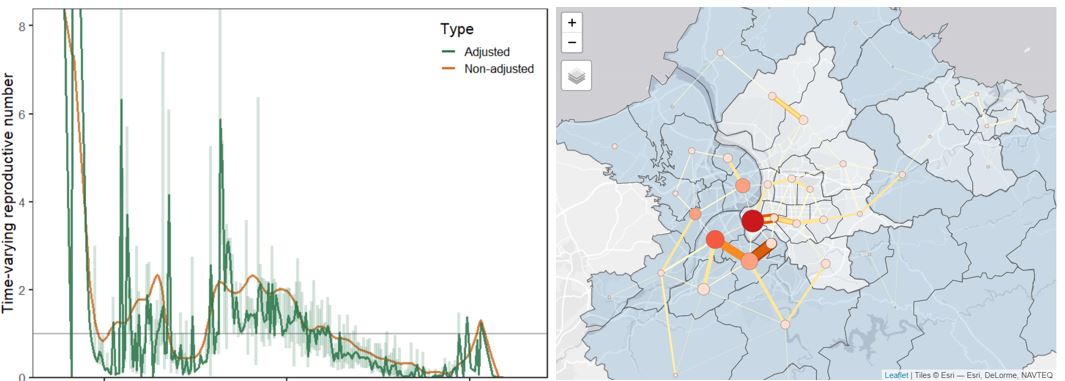
e-Atlas: Taiwan Census Explorer 1956-2010
|
link
Language: HTML + Javascript
Introduction:
We built the
Web-based Taiwan
Social Explorer, which is an interactive map platform
for exploring Taiwan
census data spatially and temporally. The control panel on the right can be used
to display different data layers. A map legend, figures, and datasets (.csv) can
be accessed using the control panel on the left. Data for this map platform was
provided by the Taiwan Census Office (1956, 1966, 1980, and 1990 data) and the
Directorate-General of Budget, Accounting, and Statistics (2000 and 2010 data).
|