Chapter 2. Role of water (vapor, cloud, ice) in Earth’s climate
2.1 Greenhouse effect (Ref. 1, /chapter_2)
Zero-dimensional, steady state climate model
So (1- ap) / 4 = sTe4,
So = Solar constant = 1367 W m-2,
ap = the planetary albedo = 0.3,
s = the Stefan-Boltzmann constant = 5.67 x 10⁻⁸ W m-2 K-4
Te = 255 oK ~ -18 oC
Current observed global mean surface temperature, Ts ~ 288 oK = 15 oC.
Earth atmosphere (water vapor, carbon dioxide, and others) is relatively transparent for solar radiation but opaque to terrestrial radiation
![]() So(1-ap)
/ 4
So(1-ap)
/ 4 ![]() sTe4
sTe4
------------------------------------------------------------ top of atmosphere
![]() sTe4
sTe4
![]() So(1-ap)
/ 4
So(1-ap)
/ 4 ![]() sTs4
sTs4
------------------------------------------------------------ surface
![]()
So(1-ap)
/ 4 + sTe4
= sTs4
![]() 2sTe4
= sTs4
2sTe4
= sTs4
Ts ~ 303 oK = 30 oC
The surface temperature is increased because the atmosphere does not inhibit the flow of solar energy to the surface, but augments the solar heating of the surface with its own downward emission of longwave radiation.
Exercise 1:
![]() So(1-ap)
/ 4
So(1-ap)
/ 4 ![]() sT14
sT14
------------------------------------------------------------ top of atmosphere
Layer 1, T1
![]() sT24
sT24
------------------------------------------------------------
![]() sT14
sT14
Layer 2, T2
![]() So(1-ap)
/ 4
So(1-ap)
/ 4
![]() sTs4
sTs4
------------------------------------------------------------ surface
![]() sT24
sT24
Appendix
Solar energy flux (the solar luminosity), Lo = 3.9 x 1026 W
Energy flux density (irradiance) at a mean distance of Earth from the sun (ro = 1.507 x 10¹¹ m), So = Lo/4pro2
Black body radiation, the cavity radiant intensity, is related to the emission from a surface of temperature T with unit emissivity by the Stefan-Boltzmann Law, Ebb = sT4, (1.1)
Emissivity, e, is the ratio of the actual emission of a body or volume of gas to the black body emission at the same temperature,
e = Ebb /sT4 (1.2)
Emission temperature of the sun, Tp = (Sp /s)1/4 = 5796~6000 K, where Sp = (Lo/4prs2) = 6.4x10⁷ Wm-2, with rs = 6.96x10⁸ m.
Emission temperature of the earth, Te, estimated by the energy balance,
Solar radiation absorbed = planetary radiation emitted
So (1- ap) p re2 = sTe4 4p re2 (1.3)
So (1- ap) / 4 = sTe4
|
|
ro |
So |
ap |
Te |
Ts |
|
Mars |
2.278 x 10¹¹ m |
598 W m-2 |
0.24 |
212 oK=-61 oC |
-62 oC |
|
Earth |
1.507 x 10¹¹ m |
1367 W m-2 |
0.30 |
255 oK=-18 oC |
15 oC |
|
Venus |
1.078 x 10¹¹ m |
2671 W m-2 |
0.77 |
228 oK=-45 oC |
480 oC |
Primordial Earth atmosphere (5 billion years to the last billion years)
Modern Earth atmosphere - resulted from outgassing (process of releasing gases from the interior of a planet). The gases released are primarily water vapor, carbon dioxide, and nitrogen. With time, the temperature of the planet would gradually increase, because of the greenhouse effect of the water vapor and carbon dioxide that would steadily build up in their atmospheres through outgassing.
The distance of Earth from the sun is such that outgassed water vapor condensed into oceans and the Ts remained near the triple point of water, where liquid water, water vapor, and ice can exist simultaneously. The collection of outgassed water vapor in the oceans stabilized the climate and provided the environment that is appropriate for the development of life as we know it. Once the condensation point was reached on Earth, any additional water vapor that was outgassed went into the oceans and the infrared opacity of the atmosphere stopped increasing. The carbon dioxide was dissolved into the ocean and eventually reached an equilibrium with carbonate rocks. At this point the atmosphere was composed mostly of molecular nitrogen. Within about a billion years after the formation of Earth, life developed, leading to green plant photosynthesis, which produces molecular oxygen in the atmosphere. With the development of an oxygen-rich atmosphere came the stratospheric ozone layer, which by protecting the surface from harmful ultraviolet-B radiation, allowed life to emerge from the water and occupy the land surface.
On Venus, Ts stayed well above the condensation point for water during the evolution, so that all of the water stayed in the atmosphere. Eventually much of the hydrogen in the atmosphere escaped to space, and a thick atmosphere of primarily CO2 remains, leading to a Ts~700K. This process is termed the runaway greenhouse effect.
On Mars, it has been speculated that the temperature mostly stayed below the freezing point for water so that the greenhouse effect may never have significantly influenced the surface temperature there. (surface erosional features?)
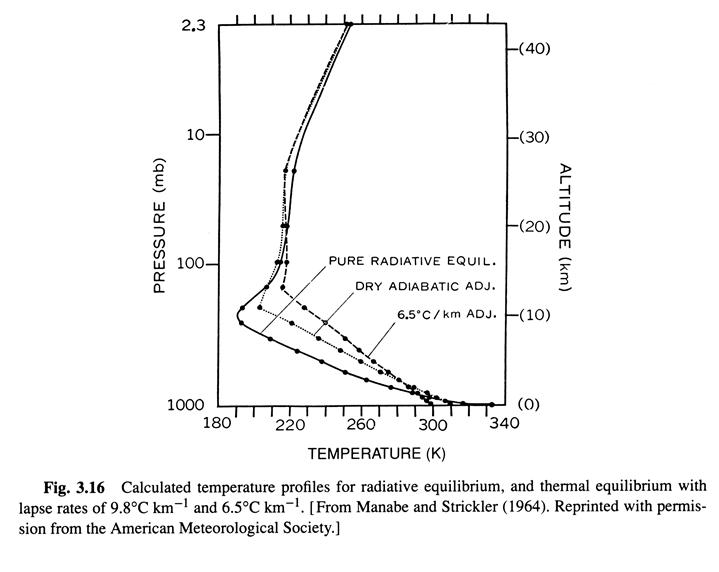
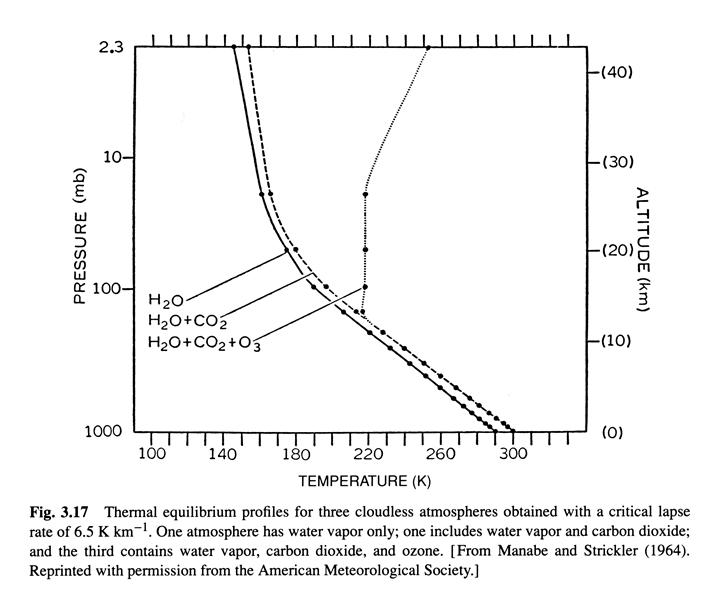
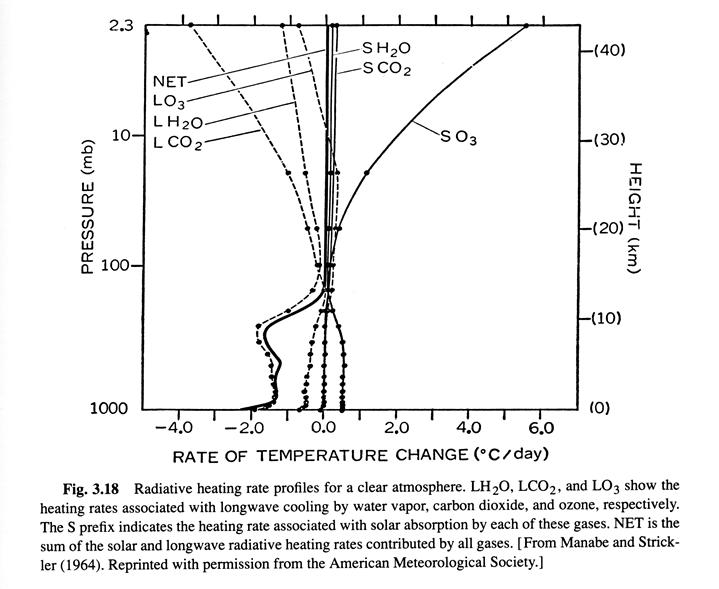
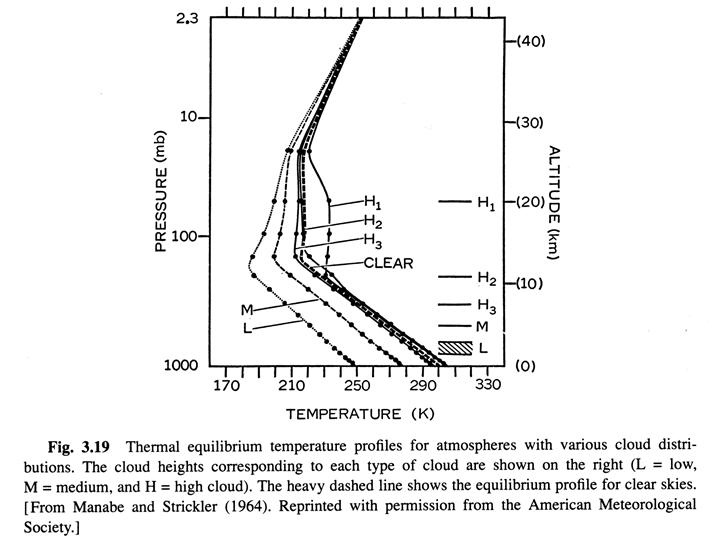
Radiative-convective equilibrium temperature distrubution 10/8 (Ref. 1, /chapter_3/3.10)
Distribution of insolution (Ref. 1, /chapter_2/2.7)
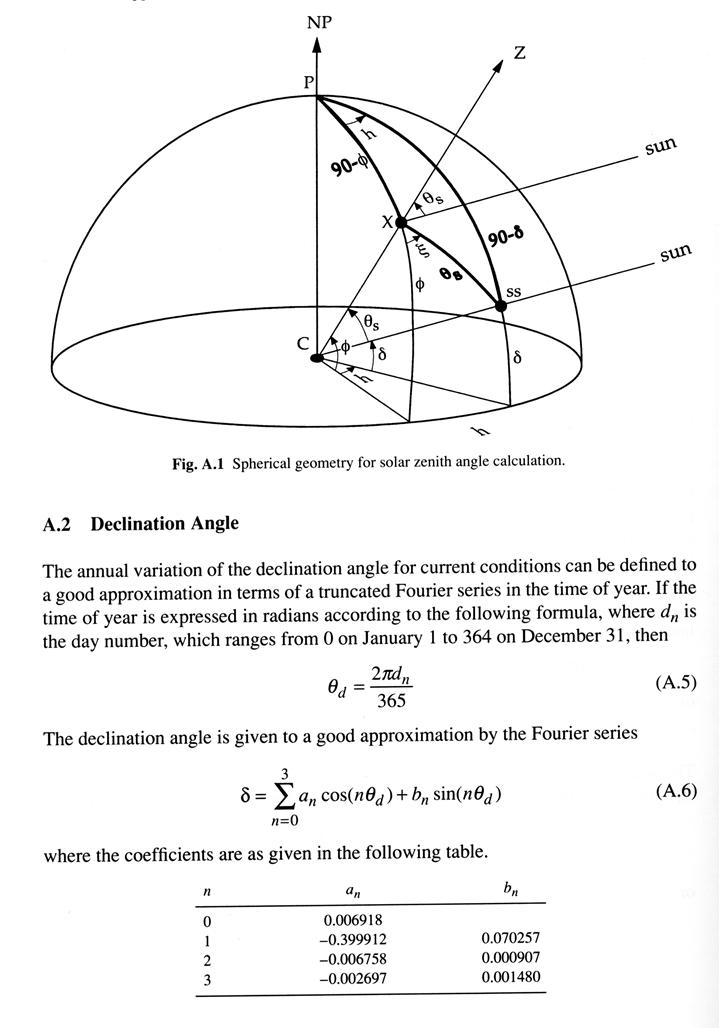
Seasonal and latitudinal variations in temperature are driven primarily by variations of insolution (or the solar flux density, Q). The geometric factors that determine insolution can written as,
Q = So (dm/d)2 cosqs, (1.4)
cosqs = sinf sind + cosf cosd cosh, (1.5)
where dm is the mean distance for which So is measured, and d is the actual distance from the sun. Other parameters are defined as follows: solar zenith angle (qs), the angle between the local normal to Earth's surface and a line between a point on earth's surface and the sun, declination angle of the sun (d), the latitude of the point on the surface of Earth directly under the sun at noon, (-23.45 at December 21 to +23.45 at June 21), hour angle (h), the longitude of the subsolar point relative to its position at noon.
latitude (f).
If the cosine of the solar zenith angle is negative, then the sun is below the horizon and the surface is in darkness. Sunrise and sunset occur when the solar zenith angle is 90∘, in which case ( 1.5) gives
cos h0 = - tan ![]() tan
tan ![]() ( 1.6)
( 1.6)
where h0 is the hour angle at sunrise and sunset.
Near the poles special conditions prevail. When the latitude
and the declination angle are of the same sign (summer), latitudes poleward of
90-![]() are constantly illuminated. At the pole the sun moves around
the compass at a constant angle of
are constantly illuminated. At the pole the sun moves around
the compass at a constant angle of ![]() above the horizon. In the winter hemisphere, where
above the horizon. In the winter hemisphere, where
![]() and
and ![]() are of the opposite sign, latitudes poleward of 90-
are of the opposite sign, latitudes poleward of 90-![]() |
|
are in polar darkness.
At the poles, six months of darkness alternate with six months of sunlight. At
the equator day and night are both twelve hours long throughout the year.
|
|
are in polar darkness.
At the poles, six months of darkness alternate with six months of sunlight. At
the equator day and night are both twelve hours long throughout the year.
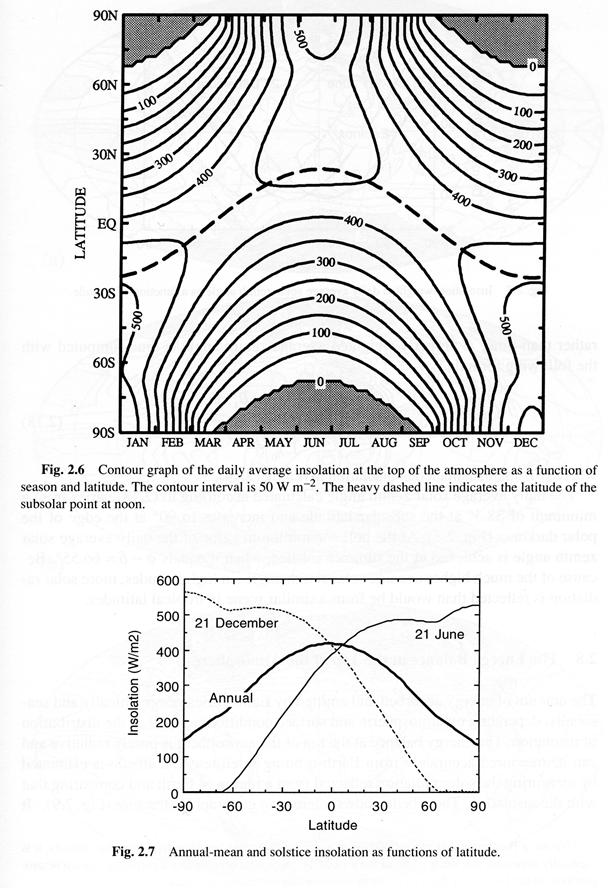
The average daily insolation on a level surface at the top of the atmosphere may be obtained by substituting ( 1.5) into ( 1.4), integrating the result between sunrise and sunset, and then dividing by 24 hours. The result is
![]() =
=  ( 1.7)
where the hour angle at sunrise and sunset, h0, must be given in radians. The daily average insolation is plotted in Fig. 2.6 as a function of latitude and season. Earth's orbit is not exactly circular, and currently Earth is somewhat closer to the sun during Southern Hemisphere summer than during Northern Hemisphere summer. As a result the maximum insolation in the Southern Hemisphere is about 6.9% higher than that in the Northern Hemisphere. Note that at the summer solstice the insolation in high latitudes is actually greater than that near the equator. This results from the very long days during summer and in spite of the relatively large solar zenith angles at high latitudes.
If the daily insolation is averaged over the entire year, the distribution given in Fig. 2.7 is obtained. The annual-average insolation at the top of the atmosphere at the poles is less than half its value at the equator, where it reaches a maximum. By comparing the annual mean insolation at the equator with the insolation at the solstices one can see that the insolation at the equator goes through a semiannual variation with maxima at the equinoxes and minima at the solstices.
Because the local albedo of Earth depends on the solar zenith angle, the zenith angle enters in determining both the available energy per unit of surface area and the albedo. It is therefore of interest to consider the average solar zenith angle during the daylight hours as a function of
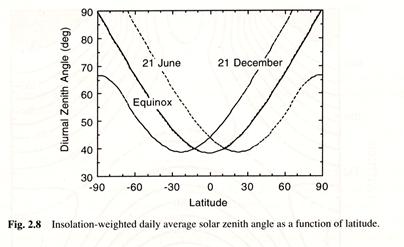
latitude and season. In calculating a daily average zenith angle it is appropriate to weight the average with respect to the insolation, rather than time. A properly weighted average zenith angle is thus computed with the following formula,
 ( 1.8)
Where Q is the instantaneous insolation given by ( 1.4).
The
daily average solar zenith angle calculated according to ( 1.8) varies from a
minimum of 38.3∘
at the subsolar latitude and increases to 90∘
at the edge of the polar darkness (Fig. 2.8). At the pole the minimum value of
the daily average solar zenith angle is achieved at the summer solstice, when it
equals ![]() = 66.55∘.
Because of the much higher average solar zenith angles in high latitudes, more
solar radiation is reflected than would be from a similar scene in tropical
latitudes.
= 66.55∘.
Because of the much higher average solar zenith angles in high latitudes, more
solar radiation is reflected than would be from a similar scene in tropical
latitudes.
2.2 Cloud Radiative effect 10/11
|
Stratocumulus clouds Albedo forcing larger than greenhouse forcing, Net cooling effect |
Deep convective clouds Albedo forcing & greenhouse forcing both large, Nearly in balance |
Cirrus clouds Albedo forcing ? greenhouse forcing large |
Hydrologic feedbacks to climate and radiative forcing
Objective measures of climate sensitivity and feedback
![]()
![]()
![]() based Fig. 9.1
based Fig. 9.1
note
![]() a 1% change in T is associated with 20% change in
a 1% change in T is associated with 20% change in
![]()
Lindzen et al. (2000)
2.3 Ice albedo and energy balance 10/15
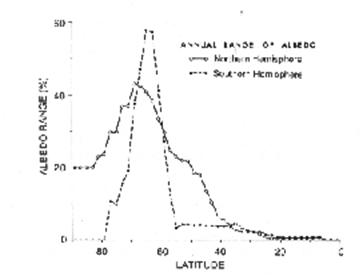
Fig. 1 Graph of the annual range of surface albedo in the Northern and Southern Hemispheres. The largest annual ranges occur in the latitude range of Antarctic sea ice in the southern Hemisphere and sea ice and snowcover in the Northern Hemisphere.
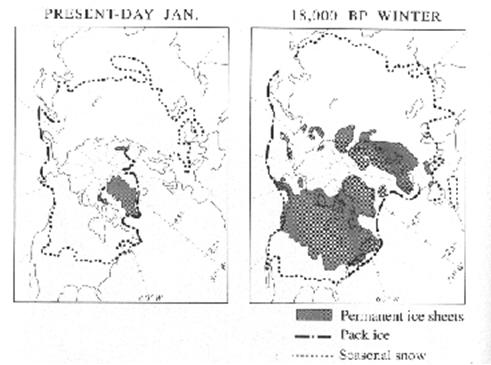
Fig. 2 Extent of permanent ice sheets (shaded), seasonal snowcover (dotted line), and pack ice (Perennial sea ice, dash-dot line) at present and estimated for the last glacial maximum.
A simple energy balance model
So/4 s(sinj) (1- ap) - sTs4 = DF
s(sinj): zonal-mean insolation distribution as a function of sine of latitude
ap(sinj, Ts): ap~0.62 for ice surface (Ts<-10oC) & ~0.3 for ice-free surface
sTs4 ~ A + B Ts
DF(sinj, Ts) ~ g (Ts-Tm)
The model may have between one and three solutions for a particular value of the solar constant. For sufficiently large solar constants, an ice-free planet is a stable solution to the model. For sufficiently small solar constants, an ice-covered planet is a stable solution. For an intermediate range of solar constants both of these stable solutions are possible.
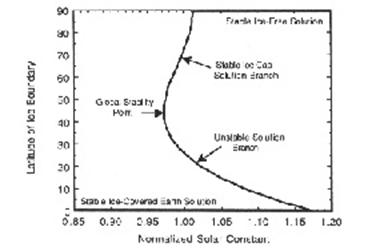
Fig. 3 Diagram showing the latitude of the boundary of the polar ice cap as a function of solar constant in the solution of the energy-balance model. The solar constant has been normalized such that the boundary of the ice cap occurs at 72o for a normalized solar constant of unity. The solution shown is for g /B=1.9.
Review of (11/5)
1. Fundamentals
2. Role of water in Earth’s Climate
3. Earth’s climate variability
Mid-term Exam – 11/5-8
Part I: plot
![]() ,
, ![]() ,
, ![]() and
and ![]() as a function of temperature
as a function of temperature
![]() ,
, ![]()
![]() ,
, ![]()
1) Water-vapor equilibrium
![]() ,
, ![]()
2) Ice-vapor equilibrium
![]() ,
, ![]()
3) Ice-water equilibrium
![]() ,
, ![]() but
but ![]()
Mid-term Exam – 11/5-8
Part II (11/8)
1. Describe the physical meaning of the following
thermodynamic first law:
![]()
Specific heat:
![]()
Specific heat:
![]()
2.
For ideal gas, ![]() ,
show
,
show ![]()
3.
Show
![]() = constant for adiabatic process.
= constant for adiabatic process.
4. Under what atmospheric conditions can we “see our breath”? Assume that the air we exhale is at T=36C and RH=80% at a pressure of
1000 mb, and find the maximum atmospheric temperature at which condensation will occur when the atmospheric RH is (a) 99.9% and
(b) 0%.
5.
The atmosphere is very close to hydrostatic relation,
![]() , draw a schematic diagram to discuss the meaning of this
relation.
, draw a schematic diagram to discuss the meaning of this
relation.
6. If an air parcel ascends vertically in such a way that there is not heat exchange between the air parcel and the ambient environment, derive
the
temperature lapse rate ![]() . Since g=9.8 m s-2,
. Since g=9.8 m s-2,
![]() for air is ~1000 J kg-1 K-1 , estimate
for air is ~1000 J kg-1 K-1 , estimate
![]()
7. What is the Bergeron-Findeisen effect?