# A brief introduction: Most gene-based association tests are underpowered given a large proportion of neutral variants within the gene. Our new method, the Adaptive Combination of Bayes Factors (ADABF) Method, removes the variants with smaller Bayes factors and so it is robust to the inclusion of neutral variants. The ADABF method is more powerful than other association tests when there are only few variants (in a gene/region) associated with the phenotypes. It can be applied to GWAS or NGS data, continuous traits or dichotomous traits, unrelated subjects or case-parent trios, and it allows for covariates adjustment. Besides, more than other gene-based association tests, the ADABF method further indicates which variants enrich the significant association signal.
Q: Why the Bayes factor is used to truncate
variants, instead of the P-value?
A: The commonly-used P-value is the
probability of obtaining a statistic as extreme as or more extreme than the
observed statistic under the null hypothesis (H0) of no association. However, a
P-value provides no information regarding the alternative hypothesis (H1) and
power, which varies with the minor allele frequencies (MAFs).
# If you use this code to analyze data, please cite the following paper:
# Lin W-Y, Chen W.J., Liu C-M, Hwu H-G, McCarroll S.A., Glatt S.J., Tsuang M.T. (2017). Adaptive combination of Bayes factors as a powerful method for the joint analysis of rare and common variants. Scientific Reports, 7: 13858. [A poster to briefly introduce this study]
# Any questions or comments, please contact: Wan-Yu Lin, linwy@ntu.edu.tw, Institute of Epidemiology and Preventive Medicine, National Taiwan University College of Public Health
# Thank you.
##########################################################################################
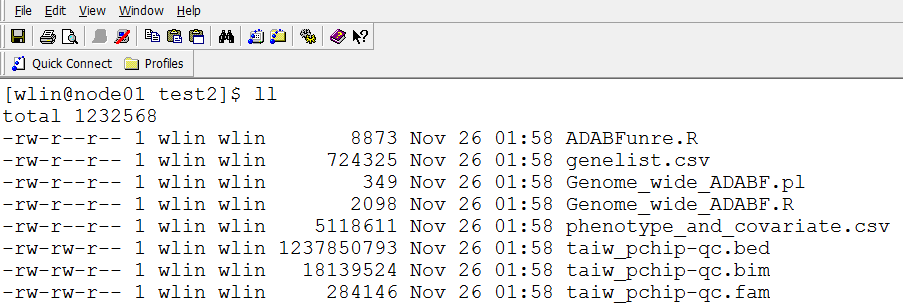
For unrelated subjects (How to perform the genome-wide ADABF analysis?):
Suppose we have "taiw_pchip-qc.bim", "taiw_pchip-qc.bed", and "taiw_pchip-qc.fam". If the phenotypes and covariates are put in "phenotype_and_covariate.csv".
Step 1, to generate the map file for each chromosome. From the following commands, we can obtain "chr1.map", ..., "chr22.map".
plink --bfile taiw_pchip-qc --recode --chr 1 --out chr1 --noweb
plink --bfile taiw_pchip-qc --recode --chr 2 --out chr2 --noweb
.........
plink --bfile taiw_pchip-qc --recode --chr 22 --out chr22 --noweb
Step 2, to recode the genotypes into 0, 1, 2. From the following commands, we can obtain "myRdata1.raw", ..., "myRdata22.raw".
plink --bfile taiw_pchip-qc --recodeA --chr 1 --out myRdata1 --noweb
plink --bfile taiw_pchip-qc --recodeA --chr 2 --out myRdata2 --noweb
.........
plink --bfile taiw_pchip-qc --recodeA --chr 22 --out myRdata22 --noweb
Genelist (the human genome GRCh37/hg19 assembly ±50 kb flanking regions of a gene) [genelist.csv]
The R code to perform the ADABF analysis for a whole chromosome [Genome_wide_ADABF.R]
The Perl script to concatenate the above actions, analyzing from chromosome 1, 2, ..., to 22 [Genome_wide_ADABF.pl]
Please put these files in a directory, and run the perl command "nohup perl ./Genome_wide_ADABF.pl &"
Then you will see the result like this:
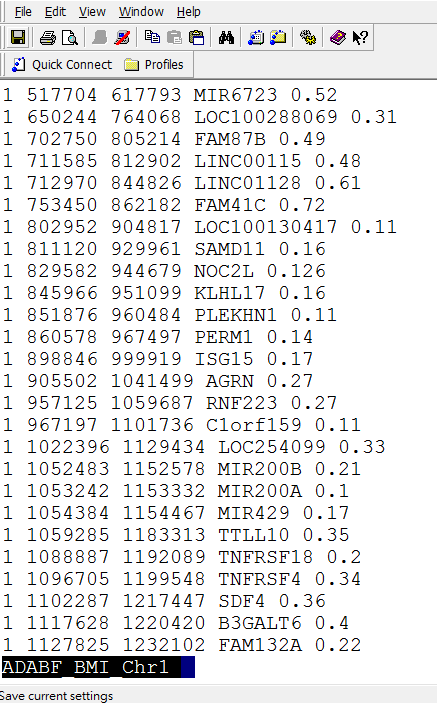
Column 1: chromosome
Column 2: starting base pair for the gene analysis, based on the human genome GRCh37/hg19 assembly -50 kb
Column 3: ending base pair for the gene analysis, based on the human genome GRCh37/hg19 assembly +50 kb
Column 4: the ADABF P-value
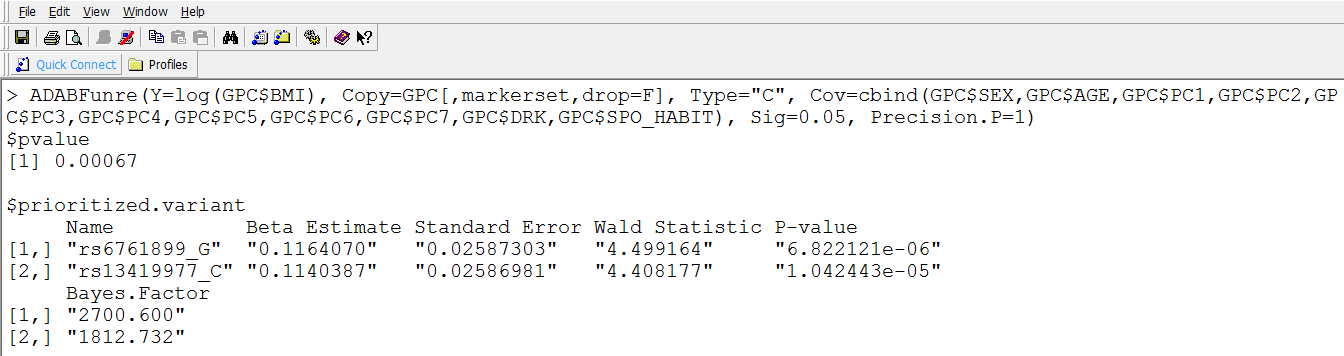
If you wish to know which variants enrich the significant association signal, please see the detailed results:
Thanks for your interest.
Return to the ADABF method webpage
Return to Wan-Yu Lin's homepage